Statement from our Chair
Unity, resilience & resolve.
H.E Hailemariam Dessalegn
Former Prime Minister of Ethiopia, Chair of the Board of Directors of AGRA
Message from our President
African challenges, uniquely African solutions.
H.E. Dr. Agnes Kalibata
AGRA President & the UN Secretary General's Special Envoy to the Food Systems Summit
Our vision is an agriculture transformation that fundamentally changes how food is produced, creating better opportunities in rural economies and providing affordable, nutritious food to the entire population.
Our Vision for Agricultural Transformation
Since AGRA was founded in 2006, our investments across Africa have been directed at increasing food and nutrition security, and incomes for smallholder farming households. So far, we have been able to track our progress against targets by evaluating the impact of our interventions in the lives of farmers.
Our Impact
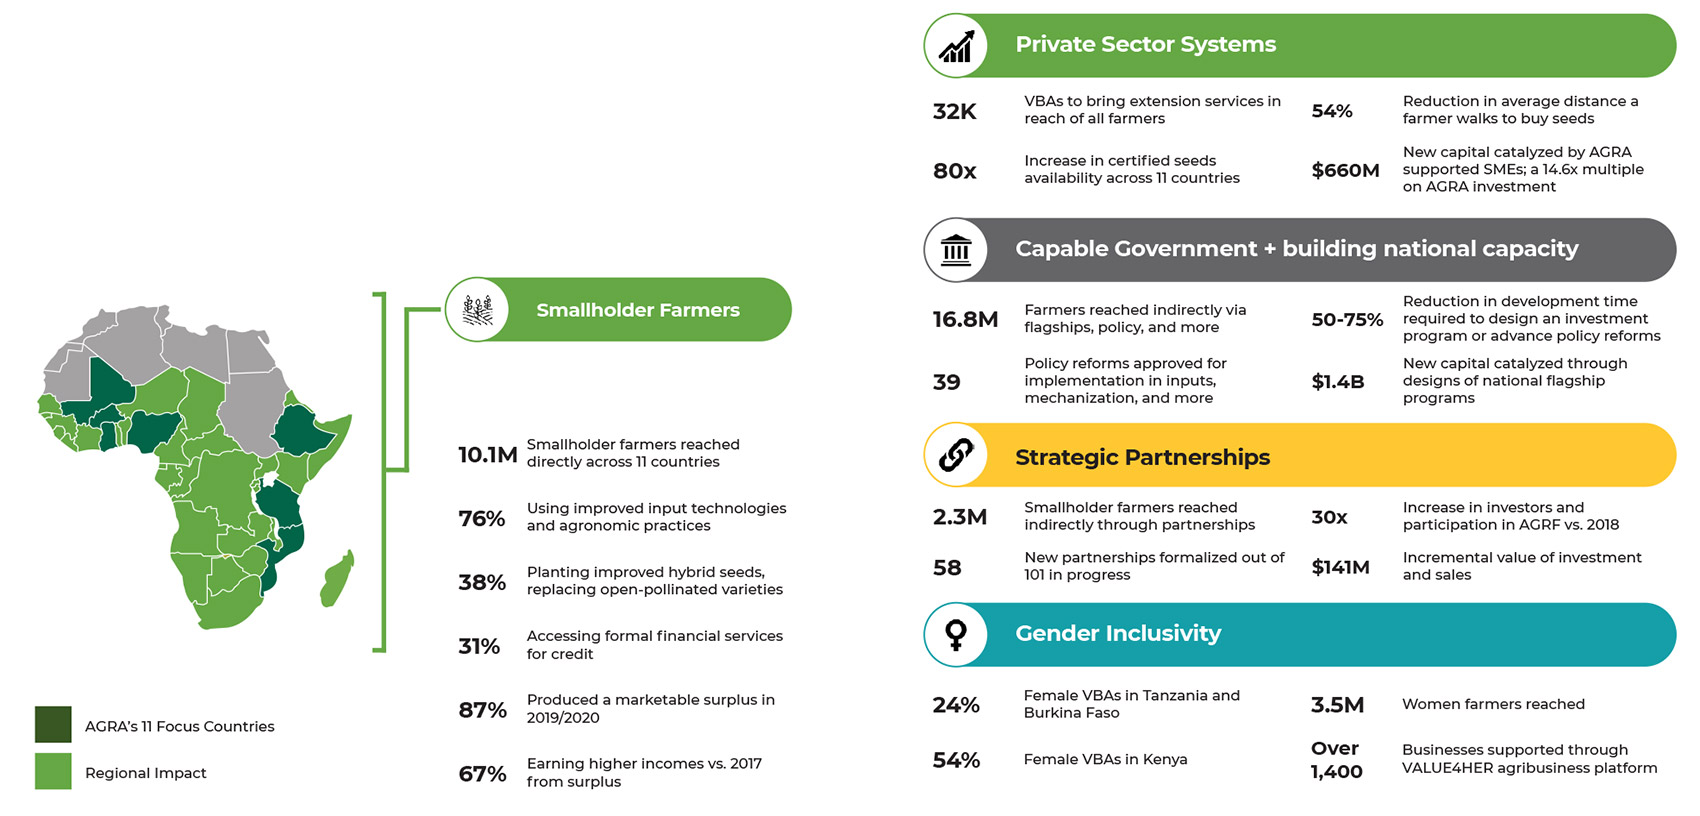
Since 2017, we have directly reached 10.1 million farmers, serving them with an integrated suite of services to improve how they farm. The impact we seek is better livelihoods and improved food security, as well as greater resilience to shocks and adversity.
Impact on Farmers
We make strategic investments into partners and systems in order to create an enabling environment and conditions such that farmers' capacity is increased, markets can be developed and businesses can grow. Our partners work with local government and farmers' organizations to build farmer capacity.
Impact on Farming Systems
We support governments to strengthen their planning, stakeholder engagement, monitoring and evaluation tools, and more. While this is a long-term investment, we already see compelling early results – evident in national investment plans, changes to long-held institutional practices, smarter and faster policy reform, and the response of private sector actors.
Impact on National Capacity
AGRA invested more than USD11 million to mitigate the adverse effects of the COVID-19 pandemic. Our investments supported food security coordination, regional food balance sheets, digital finance, supply chain investments, improved seeds, strengthening SMEs, data and analytics, political economy analysis, and rapid COVID-19 responses. We also developed our thought leadership to assess the real-time impact of COVID-19 on market systems and businesses, along with recovery planning.
AGRA's Covid- 19 Response
2020 Highlights
Institutional highlights

Reached 4 Million
Smallholder farmers directly and 12,2 million farmers indirectly in 11 countries

10,000+ Delegates
Attended AGRF Summit in-person and virtually

28 Policy reforms
Advocated to unlock bottlenecks in seeds, markets, fertilizer systems

$ 43.3 million
Disbursed in grants to implementing partners in 2020 across 11 countries

$ 11 million
To mitigate COVID-19 pandemic
Gender and Inclusiveness

1.4 million women farmers
reached in 2020

47% of SME Dealroom participants
are women-led.

600 companies registered
by women, through the VALUE4HER- Connect plaform, accessing market information
Systems

23 consortia
In 2020, support focused on maturing of investments

1.3 million farmers reached via consortia
AGRA demonstrated & used the powerful effects of consortia in creating a more vibrant private sector and delivering an integrated approach

Piloted environmental sustainability project in western Kenya
Supporting renewal of degraded lands,to implement / scale sustainable land and agro- biodiversity management practices
PSC highlights

6 Countries supported
To develop Institutional Capacity Strengthening Plans

Over $15 million
Leveraged through the expanded regional food trade Programme, in private investments in Eastern Africa

9 Flagships
Being implemented with AGRA support
Partnerships

47% of SME Dealroom participants
are women-led.

600 companies registered
by women, through the VALUE4HERConnect plaform, accessing market information

1.4 million women farmers
eached in 2020
AGRA’s work in seeds

Developed SSA & assessment tool
(Seed system analysis) piloted in Nigeria and Ethiopia

Supported digitization
of seed certification, use of Seed Tracker through electronic tags, and e-certification in Uganda

80% of seed produced locally
In Rwanda up from only 14% in 2017

Promoted soil health
Through increasing adoption of organic & biofertilizers
Our Leadership
Financial Report
Statement of Financial position as 31st December 2020
Consolidated statement of financial position
IN THOUSANDS |
NOTE |
2020 US$ |
2019 US$ |
ASSETS |
|||
CURRENT ASSETS |
|||
| Cash and cash equivalents | 3 | 59,845 | 59,378 |
| Receivables and prepaid expenses | 4 | 3,266 | 3,335 |
| Investments in BlackRock | 5 | 28,711 | 27,968 |
| Total current assets | 91,822 | 90,681 | |
NON-CURRENT ASSETS |
|||
| Investments in Injaro | 6 | 1,168 | 1,490 |
| Investments in Financial Assets | 7 | 779 | 1,711 |
| Investments in ABC Fund | 8 | 4,740 | 2,256 |
| Intangible assets, net | 9 | 209 | 282 |
| Property and equipment, net | 10 | 902 | 964 |
| Total non-current assets | 7,798 | 6,703 | |
| Total Assets | 99,620 | 97,384 | |
LIABILITIES AND NET ASSETS |
|||
| Accounts payable and other liabilities | 11 | 7,137 | 6,834 |
| Contributions payable | 12 | 6,659 | 7,069 |
| Repayable Loans | 13 | 12,918 | 12,632 |
| Program grants payable | 14 | 1,770 | |
| Total liabilities | 28,484 | 26,535 | |
NET ASSETS |
|||
| Without donor restrictions | 15 | 9,500 | 8,301 |
| With donor restrictions | 15 | 61,636 | 62,548 |
| Total net assets | 71,136 | 70,849 | |
| Total liabilities and net assets | 99,620 | 97,384 |
Consolidated statement of activities
REVENUE |
|||
| Contributions received | 16 | 93,703 | 117,661 |
| Net investment income | 17 | 1,007 | 1,157 |
| Other income | 17 | 1,602 | 949 |
| Total revenue | 96,312 | 119,767 | |
OPERATING EXPENDITURE |
|||
| Grants | 14 | 52,728 | 52,911 |
| Other Program Costs | 18 | 8,140 | 11,739 |
| ASIF Costs | 1,057 | 633 | |
| AECF Program Costs | 18 | 6,965 | 7,598 |
| Monitoring and Evaluation Costs | 18 | 2,879 | 2,849 |
| Program support Costs | 18 | 15,951 | 19,476 |
| Resource Mobilization Costs | 18 | 692 | 673 |
| Administration and support Costs | 18 | 7,613 | 9,351 |
| Total expenditure | 96,025 | 105,230 | |
| Change in net assets | 287 | 14,537 |


